The idea
Prospectivity mapping should sharpen a geologist's thinking, not replace it. Many workflows hand the decision to the model: data goes in, a heat map comes out, and the reasoning behind each target is hard to see or change.
This tool works the other way round. It walks the geologist through each type of evidence for an area (mapped geology, geochemistry and drilling, structures, geophysics and ground constraints), models each one with the method that suits it, and leaves every judgement call in the geologist's hands: which inputs matter, how much weight each carries, how they are combined and where ground is ruled out. The output is a prospectivity map that can be traced back to every one of those decisions.
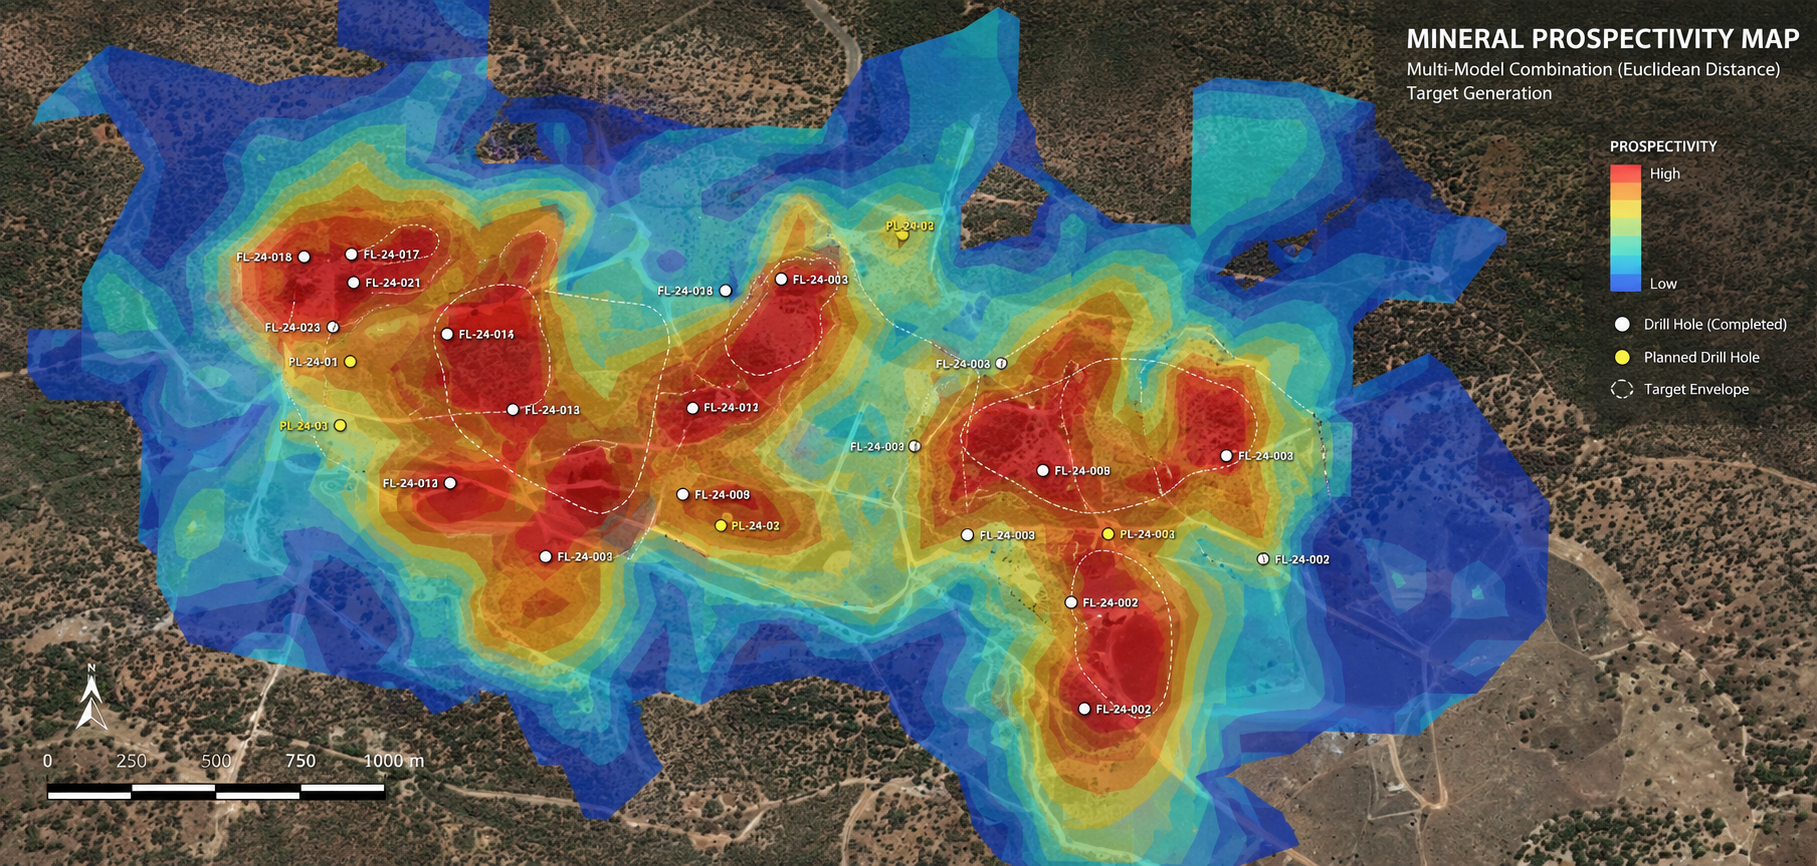
As a proof of concept at Mt Gilmore in New South Wales, soil-sample results were deliberately left out of the model, and the prospectivity map predicted them.
Outputs are standard GeoTIFF rasters that open in any GIS. A demo of the interface is available at shmit98.github.io/MPM-2026-Redo.
How each type of evidence is modelled
(val − min) / (max − min), clipped to [0, 1]The workflow
- Geology (polygons) — Lithological or alteration polygons are converted to boundary lines, rasterised, and used to generate a proximity distance raster. Optional per-unit weighting applies relative geological importance before normalisation.
- Point geochemistry (CSV) — Sample data projected to GDA94 MGA zone. Ordinary Kriging run independently for each selected element column, outputting a continuous interpolated surface per element.
- Structural lineaments (polylines) — Fault or structural polyline shapefiles rasterised and converted to Euclidean distance rasters. Distance clipped to a user-defined cutoff radius, then inverted so proximity = high favourability.
- Geophysical / processed rasters — Existing raster datasets (e.g. magnetics, radiometrics) thresholded at the 95th percentile, vectorised, dissolved, and converted to a proximity raster.
- Constraints — Hard exclusion masks applied as binary overlays: attribute-based polygon filters, buffer zones, or slope thresholds. Constrained cells are zeroed out of the final model.
- Prospectivity model — All normalised evidence layers combined using WLC, OWA or fuzzy gamma. User controls individual layer weights via interactive sliders; output is a continuous 0–1 prospectivity raster exported as GeoTIFF.